

Viticulture Bulletin – Winter 2020/21
View below, or in the original pdf format here.
SYNOPSIS - This bulletin covers the vines’ winter dormancy, beginning in November at the start of the viticultural year, which in the northern hemisphere runs from November to October. This winter was generally mild (with the exception of the first half of January) and rainfall was close to the seasonal average.
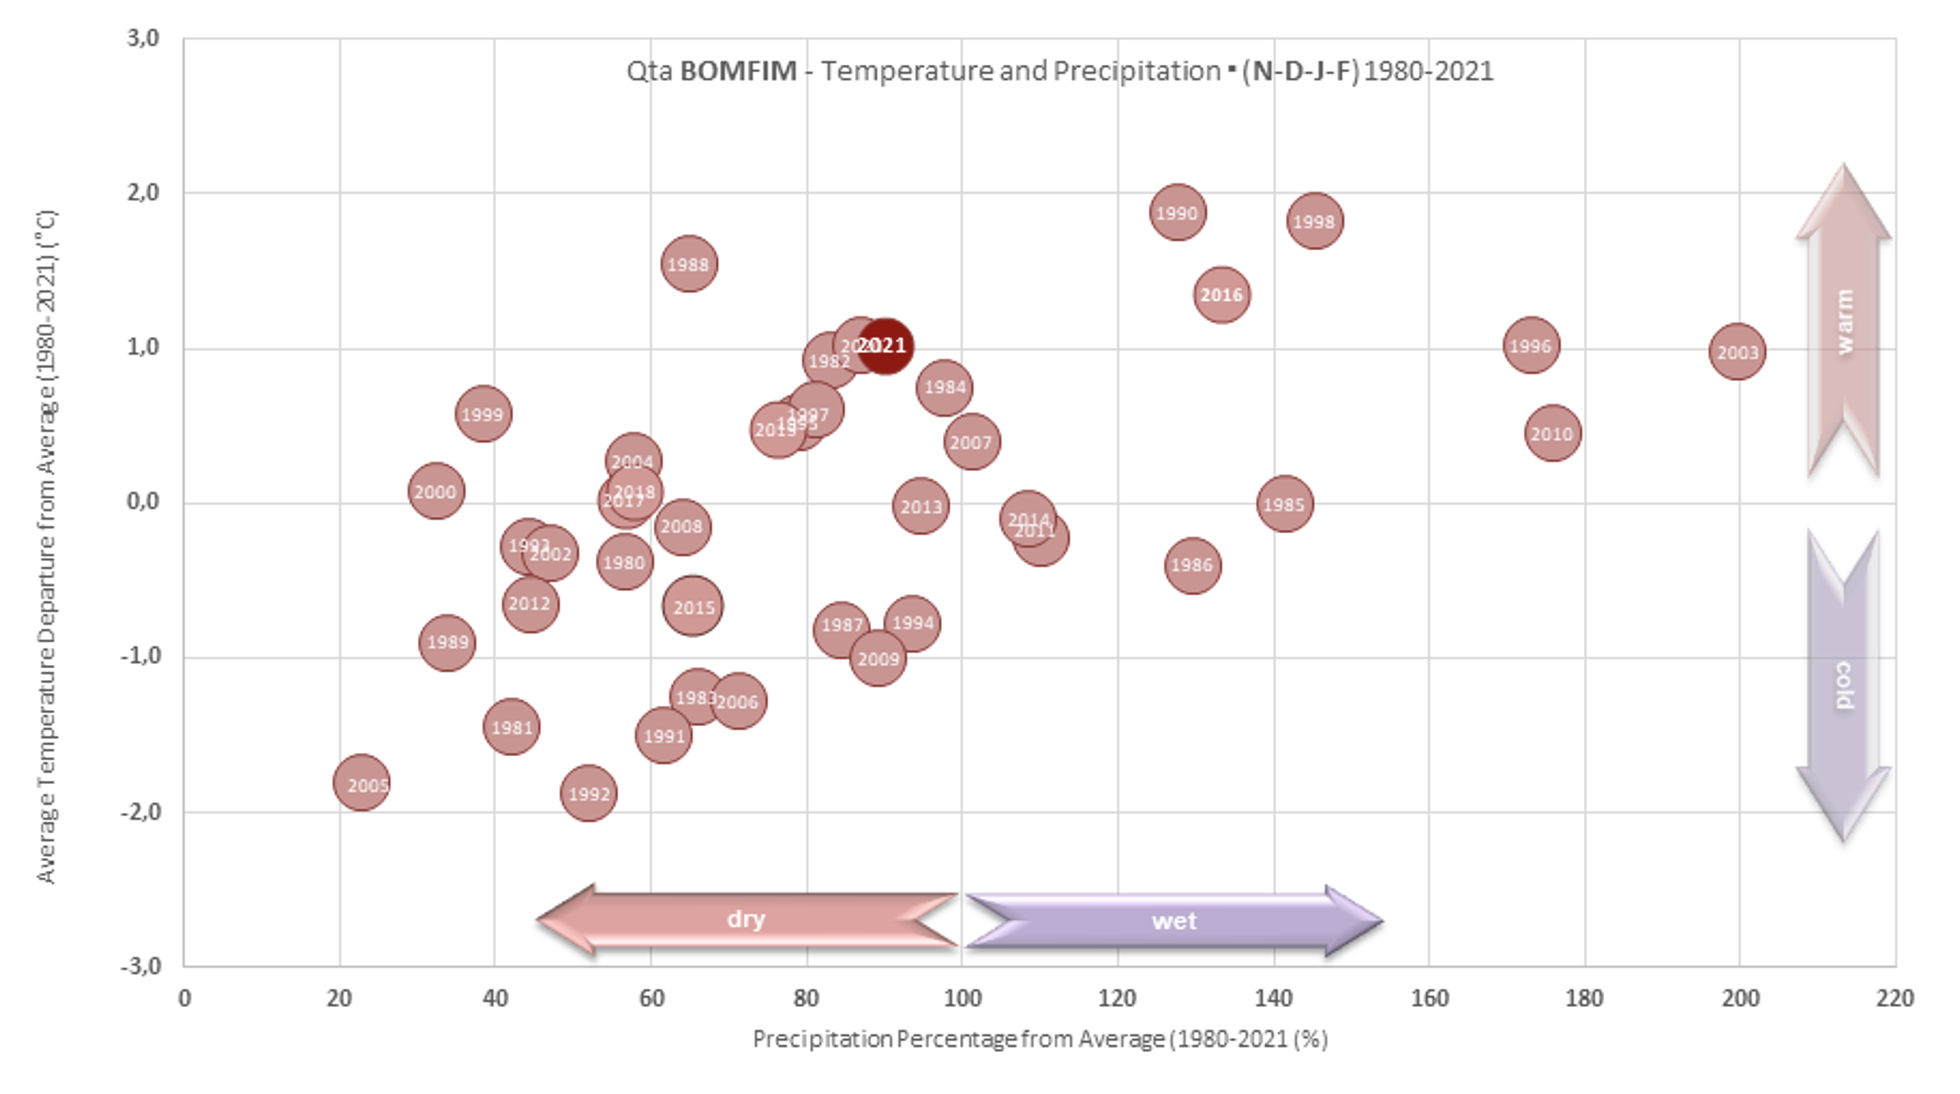
Fig.1: Average temperature and precipitation % departure from normal at Pinhão (Bomfim).
Comparative figures for the months of November 2020 to February 2021
November was mild, considered ‘very warm’ by the Portuguese Met Office, which indicated it was the second warmest November since 2000. In our Cima Corgo quintas, Bomfim excepted, rainfall was close to the 30-year average, whilst in the Douro Superior it was well above average (Vesúvio had 80% more rainfall). December temperatures were also warmer than usual, and rainfall dropped to about half the average for the month, although this shortfall was compensated by the generous rain of the previous month — particularly in the Douro Superior.
2020 will be remembered, more than anything else for the Covid-19 pandemic, but for the purposes of this bulletin it is worth noting that it was one of the five hottest years in Portugal since 1930, and the World Meteorological Organization has indicated that it will have been the third hottest ever recorded globally (equalling or even surpassing 2016).
Normal winter conditions only really kicked in during early January 2021, with a sharp drop in temperatures throughout the Douro. We recorded sub-zero temperatures in all of our network of weather stations, the lowest registered was at Quinta do Ataíde with –6.4°C on one day. This cold spell, which was also very dry (not a drop of rain fell), came to an abrupt conclusion on January 20th when temperatures shot up overnight by about 10°C, accompanied by rainfall, which came down regularly for the rest of the month.
The warm spell continued throughout February, with average temperatures 2°C above the 30-year mean. The month was very wet, and all our weather stations indicated higher than normal levels of precipitation: Cavadinha had 130% more rain than average; Bomfim 60%; Malvedos 79%; Vesúvio 38%; Canais 28%; Vale Coelho 75% and Ataíde 90%. The warm conditions contributed to a rapid rise in the number of Growing Degree Days (temps at or above 10°C — the minimum for growth in the vine), higher than in 2020 and well above the average of recent years. This brought forward the beginning of this year’s growth cycle by several weeks, very much in line with what happened in 2020.
Budbreak: the vines emerged from the winter slumber three weeks earlier than average, with budbreak recorded at our Quinta do Bomfim control vineyard (Touriga Franca) on March 4th.
Soil water levels: the abundant rainfall in February reinforced soil water reserves and currently we are close to Field Capacity (the maximum amount of water that can be stored in the soil) — a good place to be.
ALENTEJO: The start of winter at Quinta da Fonte Souto followed a slightly different pattern to the Douro, December was both colder and wetter than average. Very low temperatures during the first half of January mirrored the Douro, although unlike the latter the temperature upswing during the second half of the month was not as pronounced. Abundant rainfall in January (155.4 mm) and February (123.4mm) provided ample replenishment of soil water reserves. Higher than average February temperatures also contributed to a precocious budbreak at Fonte Souto, recorded on the 1st of March (Alicante Bouschet and Alfrocheiro).
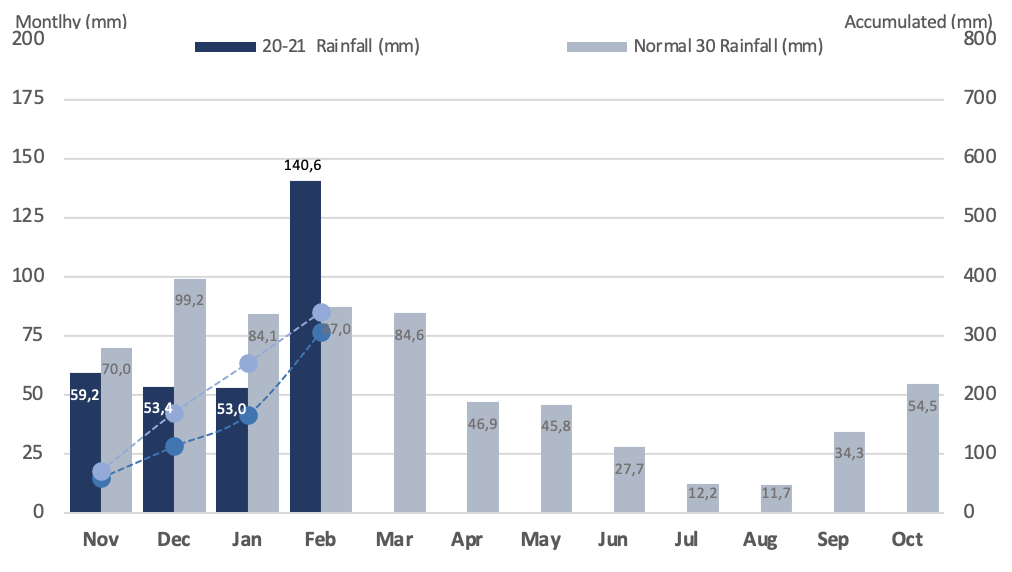
Fig. 2a (above): Monthly and accumulated rainfall compared to the mean
Quinta do Bomfim weather station: 2020/2021 viticultural year (November - February)
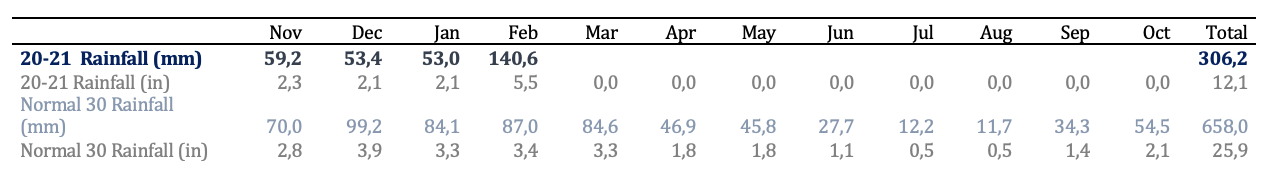
Fig. 2b: Monthly and accumulated rainfall in millimetres and inches compared to the mean
Quinta do Bomfim weather station: 2020/2021 viticultural year (November – February)
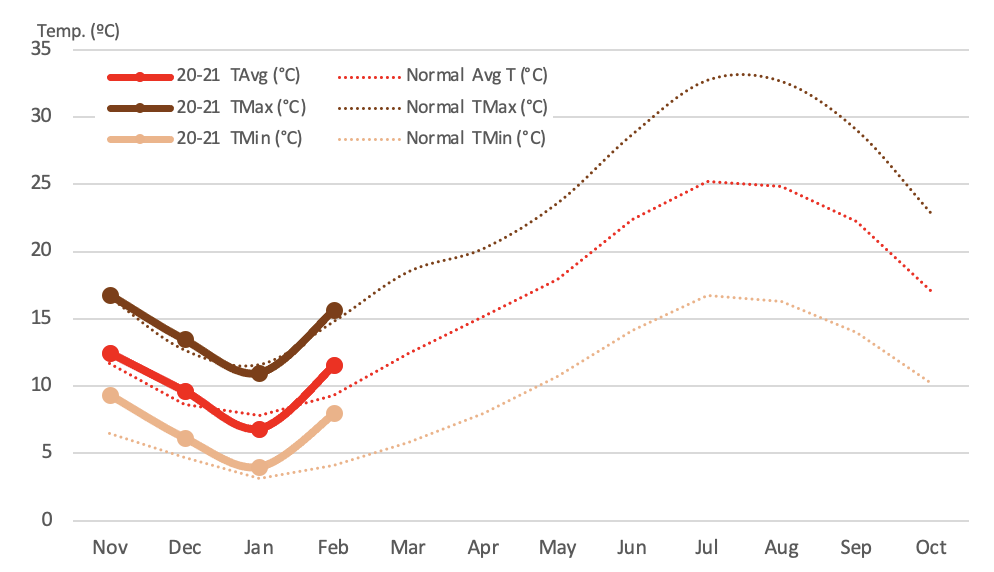
Fig. 3a: Progression of average, maximum and minimum monthly temperatures compared to the mean
(Qta. do Bomfim) – November 2020 – February 2021.
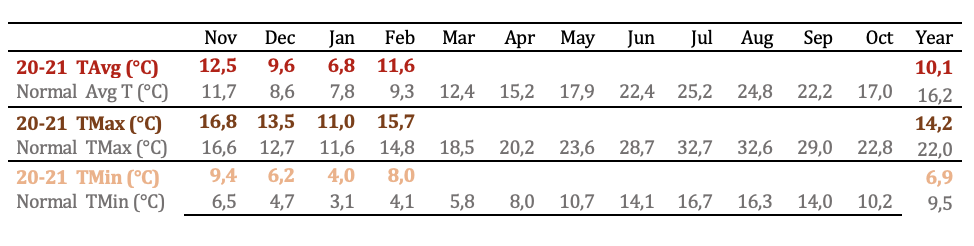
Fig. 3b: Progression of average, maximum and minimum monthly temperatures compared to the mean (Qta. do Bomfim) – November 2020 – February 2021.
Fernando Alves and Miguel Potes · March 17th, 2021
